
Supported devices: NETIO 4All, PowerPDU 4C, PowerDIN 4Pz, PowerBOX 4Kx, PowerPDU 8QS
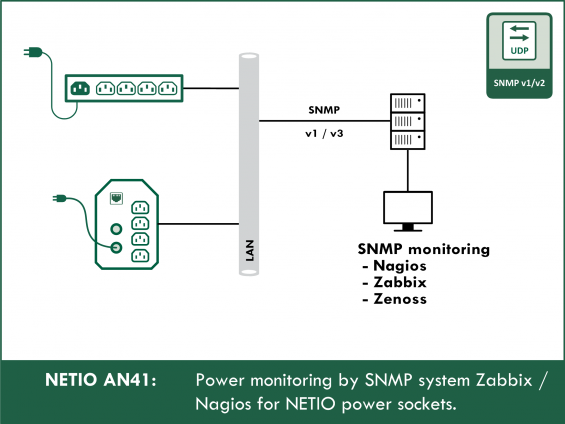
The AN41 Application Note demonstrates the use of a SNMP monitoring system and shows how to monitor power in IT and other applications.
Problem statement
For our AN41 demonstration, let us take a NETIO PowerPDU 4C with the following appliances connected to its outputs:
- Output1 - Fridge
- Output2 - Kettle
- Output3 - Coffee machine
- Output4 - Microwave oven
Goals for AN41
- Measure the consumption at all sockets and display it in graphs.
- Send an e-mail notification whenever the kettle is turned on.
- Send an e-mail warning whenever the fridge door is left open.
- Send an e-mail warning if the fridge stops working.
The PowerPDU 4C is connected to a LAN
- IP address: 192.168.101.31
- SNMP: Read permissions for the SNMP community: netioVkuchynce7523
- Our PC and the monitoring server with Zabbix can access the NETIO device over SNMP
How SNMP works
SNMP is a protocol for remote monitoring and control of devices. With NETIO smart power sockets, SNMP can be used to read OID object values (socket state (0/1), the immediate current [mA], and the consumption counter [Wh]).
By writing values over SNMP, the output can be controlled (switched on/off, toggled, briefly switched on or off). However, we recommend to use the more secure SNMP v3 for writing values.
Values are identified by their OID in a hierarchical tree.
A variable can be identified with its number or its textual name.
SNMP OID
In AN41, we will be using the numeric OIDs. Although text identifiers are clearer, they require importing the NETIO MIB into the monitoring software. Not all SW tools support MIBs.
In the hierarchical tree of OID values, NETIO has the following assigned prefix/path: .1.3.6.1.4.1.47952.
For a detailed description of SNMP in NETIO products, including examples and guides for installing the utilities, see AN11: AN11 SNMP management of 110/230V power outlets from the command line in Windows and Linux
NETIO variables accessible over SNMP
The following table lists the OIDs useful for AN41:
|
OID |
OID name |
Type |
Description / Note |
|
1.3.6.1.4.1.47952.1.1.1.2.x |
NetioOutputName |
STRING |
Name of the socket/output no. “x” (set in the Web interface) |
|
1.3.6.1.4.1.47952.1.1.1.3.x |
NetioOutputState |
INTEGER |
State of socket no. “x” (0=off, 1=on) |
|
1.3.6.1.4.1.47952.1.1.1.25.x |
netioOutputLoad |
INTEGER |
Load at socket no. “x” [W] |
|
1.3.6.1.4.1.47952.1.1.1.26.x |
netioOutputEnergy |
INTEGER |
Energy consumed through socket no. “x” [Wh] The time when the measurement started is stored under netioOutputEnergyStart OID. |
|
1.3.6.1.4.1.47952.1.1.1.27.x |
netioOutputEnergyStart |
DateAndTime |
Start time for “netioOutputEnergy”. UTC *1 [DateAndTime] |
|
1.3.6.1.4.1.47952.1.1.1.28.x |
netioOutputCurrent |
INTEGER |
Electrical current drawn from socket no. “x” [mA] |
|
1.3.6.1.4.1.47952.1.1.1.29.x |
netioOutputCurrentPowerFactor |
INTEGER |
Power factor of the load at socket no. “x” [cos phi * 1000] E.g. when cos(phi)=0.534, the value is 534 |
The “x” in the OID is a placeholder for the output (socket) number. That is 1 to 4 for NETIO 4 or PowerPDU 4C, or only 1 for PowerCable REST 101x.
Individual OID values are internally updated every 2 seconds (NETIO 4, NETIO 4ALL and PowerPDU 4C). More frequent reading over SNMP does not bring any benefit and only increases the load on the NETIO device and the monitoring system. This period also needs to be taken into account when considering the accuracy of measuring immediate load and current – it is not possible to accurately and reliably measure a load whose consumption changes more rapidly than once in about 5 seconds.
What to measure: Wh or A / W ?
Two kinds of values can be used for energy monitoring:
1) Consumption counter [Wh] - measures the total energy transferred through the socket (netioOutputEnergy [Wh])
- Accurate determination of the total consumption in Wh
- NETIO device takes care about calculating the consumed energy
- Less demanding on the monitoring system (it is possible to measure just once a day and the measurement will still be accurate)
- Less clear and understandable values in graphs: What is shown is either the total consumption that is constantly rising; or more often, the increase in total consumption during a unit of time, such as Wh/s.
- Measurement accuracy depends on the internal measurement accuracy of the NETIO device, it is not distorted by the monitoring and reading.
- The reading is in Wh, which limits the ability to measure and evaluate short-term loads or small loads. The value is an integer in Wh: for example, with a 50 W load, the value increases by 1 every 72 seconds.
2) Immediate current [A] - (netioOutputCurrent [mA] or netioOutputLoad [W]), the total energy consumption is calculated by the monitoring software
- To monitor circuit breaker capacity, the immediate value is more suitable (netioOutputCurrent [mA] or netioOutputLoad [W])
- Some graphs of current and some results may be easier for the users to understand
- When measuring, the values need to be read at least twice as often as is their rate of change. Most monitoring software reads once in 5 minutes, which is only sufficient in some cases.
- If the load is active only for a short time, or the consumption often fluctuates, the value needs to be read more frequently than it changes. For example, if the period of high consumption lasts 30s (e.g. the time to bring water in the kettle to boil), and we read the values once every 5 minutes (default for most monitoring systems), most likely the consumption will not be recorded at all.
In most situations, we recommend to combine the measurement of both kinds of values.
The general measurement accuracy of NETIO smart socket devices is better than 1% in case of Power PDU and PowerCable REST 101x, and better than 2% in case of Netio 4.
Configuring SNMP in PowerPDU 4C
In the NETIO device, enable SNMP access. For read access (monitoring), SNMP v1 is sufficient.
At the M2M API protocols -> SNMP tab:
- Enable SNMP: X
- Port: 161 (deafult)
- SNMP version: 1,2c
- Community: SNMP-community - this is a “password” and we will need to enter it in the software used to read values from the NETIO device over SNMP. In this AN, we are using “netioVkuchynce7523”
- Save Changes

Note: If writing is also needed (sockets need to be controlled), SNMP v3 must be used.
Reading over SNMP using the command line and Net-SNMP utilities
This method of reading values is useful for checking that things work, or for simple usage in scripts.
The following examples use Net-SNMP on Linux. Examples for Windows are shown in AN11: AN11 SNMP management of 110/230V power outlets from the command line in Windows and Linux
Syntax (SNMP v1):
snmpget -v 1 -c <SNMP-community> <IP> <OID>
$ snmpget -v 1 -c netioVkuchynce7523 192.168.101.31 .1.3.6.1.4.1.47952.1.1.1.28.1
iso.3.6.1.4.1.47952.1.1.1.28.1 = INTEGER: 17
The value of 17 means that the immediate current drawn from socket no. 1 is 17 mA.
snmpget -v 1 -c netioVkuchynce7523 192.168.101.31 .1.3.6.1.4.1.47952.1.1.1.26.1
iso.3.6.1.4.1.47952.1.1.1.26.3 = INTEGER: 25132
The value of 25132 means that the total energy consumed through socket no. 3 is 25132 Wh (the start time of the measurement can be read from OID 27.3).
If SNMP v3 is used:
$ snmpget -v 3 -a SHA -A onlinedemo -l authPriv -u onlinedemo -x AES -X onlinedemo netio-4c.netio-products.com iso.3.6.1.4.1.47952.1.1.1.28.1
iso.3.6.1.4.1.47952.1.1.1.28.1 = INTEGER: 2577
Analysis of the problem statement and NETIO capabilities
Measure the consumption at al sockets and display it in graphs
The following OIDs will be monitored and displayed in graphs:
- Output1-Load .1.3.6.1.4.1.47952.1.1.1.25.1
- Output1-OutputEnergy .1.3.6.1.4.1.47952.1.1.1.26.1
- Output1-Current .1.3.6.1.4.1.47952.1.1.1.28.1
- Output2-Load .1.3.6.1.4.1.47952.1.1.1.25.2
- Output2-OutputEnergy .1.3.6.1.4.1.47952.1.1.1.26.2
- Output2-Current .1.3.6.1.4.1.47952.1.1.1.28.2
- Output3-Load .1.3.6.1.4.1.47952.1.1.1.25.3
- Output3-OutputEnergy .1.3.6.1.4.1.47952.1.1.1.26.3
- Output3-Current .1.3.6.1.4.1.47952.1.1.1.28.3
- Output4-Load .1.3.6.1.4.1.47952.1.1.1.25.4
- Output4-OutputEnergy .1.3.6.1.4.1.47952.1.1.1.26.4
- Output4-Current .1.3.6.1.4.1.47952.1.1.1.28.4
Send an e-mail notification whenever the kettle is turned on
The kettle is connected to Output2. From the previous measurements, we know its power input is about 2000 W. Bringing the minimum volume of water to boil takes 93 seconds.
An even will be generated whenever the load at socket 2 exceeds 1500 W – Output2-Load – OID .1.3.6.1.4.1.47952.1.1.1.25.2.
The measurement will be done in Zabbix, where the default polling period is 30 seconds, which is sufficient. We will not worry about shorter intervals, e.g. re-heating water that was already hot.
Note:
A similar use case can be handled by sending e-mail from a Lua script that runs directly in the NETIO power sockets device – see AN03 Switching OFF a 230V power socket when current exceeds limit, email alerts
Fridge
The requirements for the fridge are:
- Send an e-mail warning whenever the fridge door is left open.
- Send an e-mail warning if the fridge stops working.
Energy consumption measurement will be used to fulfil both requirements. The fridge is connected to Output1, so we will read and monitor Output1-OutputEnergy: .1.3.6.1.4.1.47952.1.1.1.26.1.
An analysis of the fridge behavior (using the graphs obtained in previous steps) reveals that:
When the compressor is running, the fridge power input is 53 W.
When the door is closed, it runs for 26 minutes per hour on average.
The total energy consumed is therefore approximately 23 Wh per hour.
We cannot distinguish a fridge with an open door from a fridge that has just been filled with warm food.
Let us measure the consumed energy over 3 hours. Therefore, this is what we need to implement in the monitoring system:
Detect the energy consumption in the past 3 hours:
- Consumtion too low (fridge out of order): < 20 Wh
- Normal operation with the door closed: 69Wh
- Consumption too high (door open) > 120 Wh
- Compresor constantly on (maximum consumption): 159 Wh
Note: The fridge consumption (compressor duty cycle) is strongly dependent on its temperature setting and the ambient temperature.
Note 2: It is also possible to monitor the Load (immediate power output in W). The advantage is that the values and calculations are more concise and intuitive. The disadvantage is that the measurement interval would be 30 seconds instead of 2 seconds, leading to reduced accuracy. However, that should not be a problem in this scenario.
Zabbix SNMP monitoring
The Zabbix documentation includes a detailed description of how to monitor custom OIDs:
https://www.zabbix.com/documentation/current/manual/config/items/itemtypes/snmp
Adding a Host
Configuration -> Hosts -> Create host
-
Host tab
- "Host name": netio-kuchynka
- "Groups": any Zabbix group
- "Agent Interfaces": Remove
- "SNMP interfaces": IP: 192.168.101.31
-
Templates tab (for optional ICMP ping monitoring that the Netio device is alive):
-
Link new Templates: "Template Module ICMP Ping"
- Add
- Update
-
Link new Templates: "Template Module ICMP Ping"

Zabbix items
Now we create Items. Items are regularly polled and stored into the database. One Item corresponds to one monitored OID (one parameter at the given outlet).
-
Items tab
- Create Item
-
Item tab
- Name: netio-kuchynka-SNMP-Output1-OutputEnergy
- Type: SNMPv1 agent
- Key: netio-kuchynka-SNMP-Output1-OutputEnergy
- SNMP OID: .1.3.6.1.4.1.47952.1.1.1.26.1
- SNMP community: netioVkuchynce7523
- Type of information: Numeric (float) (the value represents the cumulative total since powering on)
- History storage period: 365d
-
Preprocessing tab
-
Preprocessing steps:
- Add
- "Change per second"
- Add
-
Preprocessing steps:
Now let us repeat these steps for the remaining 3 outlets, with the respective OIDs for Current, Load and OutputEnergy:
- Open the Item added in the previous step and select “Clone”.
-
In the cloned Item, make these changes:
- Name: netio-kuchynka-SNMP-Output2-OutputEnergy
- Key: netio-kuchynka-SNMP-Output2-OutputEnergy
- SNMP OID: .1.3.6.1.4.1.47952.1.1.1.26.2
- Add
The resulting Items will be:
- netio-kuchynka-SNMP-Output1-Current .1.3.6.1.4.1.47952.1.1.1.28.1
- netio-kuchynka-SNMP-Output1-Load .1.3.6.1.4.1.47952.1.1.1.25.1
- netio-kuchynka-SNMP-Output1-OutputEnergy .1.3.6.1.4.1.47952.1.1.1.26.1
- netio-kuchynka-SNMP-Output2-Current .1.3.6.1.4.1.47952.1.1.1.28.2
- netio-kuchynka-SNMP-Output2-Load .1.3.6.1.4.1.47952.1.1.1.25.2
- netio-kuchynka-SNMP-Output2-OutputEnergy .1.3.6.1.4.1.47952.1.1.1.26.2
- netio-kuchynka-SNMP-Output3-Current .1.3.6.1.4.1.47952.1.1.1.28.3
- netio-kuchynka-SNMP-Output3-Load .1.3.6.1.4.1.47952.1.1.1.25.3
- netio-kuchynka-SNMP-Output3-OutputEnergy .1.3.6.1.4.1.47952.1.1.1.26.3
- netio-kuchynka-SNMP-Output4-Current .1.3.6.1.4.1.47952.1.1.1.28.4
- netio-kuchynka-SNMP-Output4-Load .1.3.6.1.4.1.47952.1.1.1.25.4
- netio-kuchynka-SNMP-Output4-OutputEnergy .1.3.6.1.4.1.47952.1.1.1.26.4
The outputEnergy variable will be stored as the increment to the previous value. This means the graphs will not show a value that is increasing forever but the consumed Wh per second (Zabbix displays all values and graphs on a per-second basis).

Zabbix Graphs
Configuration -> Hosts -> netio-kuchynka, Graphs tab
-
"Create graph"
- Name: netio-kuchynka-OutputEnergy
- Height: 300
- Y axis MIN value: Fixed, 0
-
Items: Add:
- netio-kuchynka-SNMP-Output1-OutputEnergy
- netio-kuchynka-SNMP-Output2-OutputEnergy
- netio-kuchynka-SNMP-Output3-OutputEnergy
- netio-kuchynka-SNMP-Output4-OutputEnergy
- We can immediately see what the graph looks like in "Preview".
- Add
Repeat the graph creation steps for Current and Load.
Zabbix Screen with available graphs
Monitoring -> Screens
-
Create screen
- Name: netio-kuchynka-SNMP
- Columns: 1
- Rows: 3
- Add
-
In the list of created Screens with the „Name“ of netio-kuchynka-SNMP, click „Actions“: Constructor
-
Click „Change“
-
Graph: Click „Select“ to select the desired graph
- Group: Zabbix group where the “netio-kuchynka” host was created
- Host: netio-kuchynka
- netio-kuchynka-SNMP-Current
- Add
-
Graph: Click „Select“ to select the desired graph
-
SImilarly, add the 2 other graphs for:
- netio-kuchynka-SNMP-Load
- netio-kuchynka-SNMP-OutputEnergy
-
Click „Change“
The Screen with graphs can be displayed in Monitoring-> Sreens -> “netio-kuchynka-SNMP”.
The Current graphs are in mA, the Load graphs are in Watts. The polling period is 30s (Zabbix default). The 2 kW consumption of the kettle at Output2 is clearly visible. When the time scale is changed, the values are recalculated and the averages for the given time are displayed. For example, when displaying the history for the last 3 months, the average kettle consumption will only amount to about 100 W.
The OutputEnergy graph is in Wh/s, corresponding to the measurement method – what is measured is the total consumption since the start of the measurement (typically corresponds to when the NETIO device was restarted). The advantage is that the sampling period is the fastest supported by the device (2 seconds for NETIO 4x) and that the measurement continues even if the monitoring server or NETIO connectivity is down.

Zabbix „Triggers“ - Generating events based on measured data
Zabbix monitoring sends an e-mail whenever the kettle is turned on.
The kettle is connected to Output2 and its power input is about 2 kW. Let us create a trigger with “Informational” severity whenever Load at Output2 exceeds 1500 W.
Procedure:
- Configuration -> Hosts
- the netio-kuchynka line, Triggers
-
„Create Trigger“
- Name: „Trigger netio-kuchynka-SNMP-Output2-Load - Kettle turned on“
- Severity: Information
- Expression: {netio-kuchynka:netio-kuchynka-SNMP-Output2-Load.last()}>1500
- Add
Test by switching the kettle on.
Zabbix sends an e-mail when the fridge door is left open
The detection relies on energy consumption – if it exceeds 120 Wh for the last 3 hours.
We use the avg function – average over an interval. In calculations and graphs, Zabbix uses the second as the unit of time.
The average consumption is compared with 120Wh / 3 hours / 3600 seconds (to convert hours to seconds) = 0,01111.
Procedure:
- Configuration -> Hosts
- the netio-kuchynka line, Triggers
-
„Create Trigger“
- Name: „Trigger netio-kuchynka-SNMP-Output1-OutputEnergy - Fridge consumption too high“
- Severity: Average
- Expression: {netio-kuchynka:netio-kuchynka-SNMP-Output1-OutputEnergy.avg(3h)}>0.01111
- Add
To test, either set the fridge to a significantly lower temperature (so that it keeps cooling for several hours to reach that temperature) or leave its door open.
Zabbix sends an e-mail if the fridge consumption is too low
The detection relies on energy consumption – if it is less than 20 Wh for the last 3 hours.
We use the avg function – average over an interval.
The average consumption is compared with 20 Wh / 3 hours / 3600 seconds (to convert hours to seconds) = 0,00185.
Procedure:
- Configuration -> Hosts
- the netio-kuchynka line, Triggers
-
„Create Trigger“
- Name: „Trigger netio-kuchynka-SNMP-Output1-OutputEnergy - Fridge consumption too low“
- Severity: Average
- Expression: {netio-kuchynka:netio-kuchynka-SNMP-Output1-OutputEnergy.avg(3h)}>0.00185
- Add
To test, either set the fridge to a significantly higher temperature (so that it will stop cooling for several hours, until the temperature rises) or unplug it.
The created triggers can be also seen and tested in graphs:

Nagios SNMP monitoring
The most common method of using SNMP is with the check_snmp plugin (script).
From the command line, measurement result can be obtained like this (example for Output1 Load):
/usr/lib/nagios/plugins/check_snmp -H 192.168.101.31 -C netioVkuchynce7523 -o .1.3.6.1.4.1.47952.1.1.1.25.1
SNMP OK - 0 | iso.3.6.1.4.1.47952.1.1.1.25.2=0
The script returns that the OID value is 0 (zero consumption at outlet 2 at the time of measurement). From a script/plugin, Nagios expects a return value indicating that the status is OK, Warning or Critical. Usually, this involves comparing the OID value with a benchmark. The comparison is done by the check_snmp script that takes the following arguments:
-w <Warning range>
-c <Critical range>
The ranges indicate when the alert is NOT generated. Attention – the logic of using ranges in check_snmp plugin calls reversed to that of Nagios and to what one would expect (for details, see https://wiki.xdroop.com/space/nagios/check_snmp).
Note: In Nagios, the script name is always check_snmp; however, the path may be different in different distributions or systems. The /usr/lib/nagios/plugins/check_snmp path is valid for Ubuntu 18, it may be different on your operating system – check the installation path for files from the monitoring-plugins-standard package.
Note: We do NOT recommend using the check_netio Nagios plugin for NETIO 4 and newer devices. The plugin uses kshell access and it was developed and tested only for the older NETIO 230 devices.
For the above problem statement, Nagios is not the most suitable because the default installation is relatively limited and does not support graphs.
The advantage of Nagios is its simplicity and extensibility with scripts. In the default installation, it is easy to monitor if individual counter values are exceeded. Therefore, let us simplify the problem statement for Nagios:
- The consumption at Output2 is greater than 2000 W. Nagios measures a value only once every 5 minutes (so that we need to “catch” the moment when the kettle is on); however, we will ignore this problem in this example and boil water in the kettle 3 times in a row.
- Detect if the coffee machine is unplugged or out of order. The coffee machine draws an idle current of 15mA. It is not useful to measure the power input [W] because it is rounded to 0 W. So, we will measure the consumption in mA.
Command-line measurement test:
- When the kettle is off:
root@sandbox:~# /usr/lib/nagios/plugins/check_snmp -H 192.168.101.31 -C netioVkuchynce7523 -o .1.3.6.1.4.1.47952.1.1.1.25.2
SNMP OK - 0 | iso.3.6.1.4.1.47952.1.1.1.25.2=0
- When the kettle is off:
root@sandbox:~# /usr/lib/nagios/plugins/check_snmp -H 192.168.101.31 -C netioVkuchynce7523 -o .1.3.6.1.4.1.47952.1.1.1.25.2
SNMP OK - 2202 | iso.3.6.1.4.1.47952.1.1.1.25.2=2202
- The coffee machine is plugged in and idle:
root@sandbox:~# /usr/lib/nagios/plugins/check_snmp -H 192.168.101.31 -C netioVkuchynce7523 -o .1.3.6.1.4.1.47952.1.1.1.28.3
SNMP OK - 15 | iso.3.6.1.4.1.47952.1.1.1.28.3=15
- The coffee machine is making coffee:
/usr/lib/nagios/plugins/check_snmp -H 192.168.101.31 -C netioVkuchynce7523 -o .1.3.6.1.4.1.47952.1.1.1.28.3
SNMP OK - 5259 | iso.3.6.1.4.1.47952.1.1.1.28.3=5259
- The coffee machine is unplugged or out of order:
root@sandbox:~# /usr/lib/nagios/plugins/check_snmp -H 192.168.101.31 -C netioVkuchynce7523 -o .1.3.6.1.4.1.47952.1.1.1.28.3
SNMP OK - 0 | iso.3.6.1.4.1.47952.1.1.1.28.3=0
We set the detection ranges and test them:
- The kettle is on and generates a critical event
/usr/lib/nagios/plugins/check_snmp -H 192.168.101.31 -C netioVkuchynce7523 -o .1.3.6.1.4.1.47952.1.1.1.25.2 -w :10 -c :2000
SNMP CRITICAL - *2165* | iso.3.6.1.4.1.47952.1.1.1.25.2=2165;:10;:2000
- The kettle is off and the status is OK:
root@sandbox:~# /usr/lib/nagios/plugins/check_snmp -H 192.168.101.31 -C netioVkuchynce7523 -o .1.3.6.1.4.1.47952.1.1.1.25.2 -w :10 -c :2000
SNMP OK - 0 | iso.3.6.1.4.1.47952.1.1.1.25.2=0;:10;:2000
- The coffee machine draws more than 10mA and the status is OK:
root@sandbox:~# /usr/lib/nagios/plugins/check_snmp -H 192.168.101.31 -C netioVkuchynce7523 -o .1.3.6.1.4.1.47952.1.1.1.28.3 -w 10: -c 5:
SNMP OK - 14 | iso.3.6.1.4.1.47952.1.1.1.28.3=14;10:;5:
- The coffee machine is unplugged and the status is critical:
root@sandbox:~# /usr/lib/nagios/plugins/check_snmp -H 192.168.101.31 -C netioVkuchynce7523 -o .1.3.6.1.4.1.47952.1.1.1.28.3 -w 10: -c 5:
SNMP CRITICAL - *0* | iso.3.6.1.4.1.47952.1.1.1.28.3=0;10:;5:
We will save the configuration corresponding to the above to the following file
/etc/nagios3/conf.d/netio.cfg
File contents:
define command{
command_name check_snmp
command_line $USER1$/check_snmp -H $HOSTADDRESS$ -C netioVkuchynce7523 -o $ARG1$ -w $ARG2$ -c $ARG3$
}
define host{
use generic-host
host_name netio
alias netio
address 192.168.101.31
}
define service{
use generic-service
host_name netio
service_description NetioOutput1Load
check_command check_snmp!.1.3.6.1.4.1.47952.1.1.1.25.2!:10!:2000
# /usr/lib/nagios/plugins/check_snmp -H 192.168.101.31 -C netioVkuchynce7523 -o .1.3.6.1.4.1.47952.1.1.1.25.2 -w :10 -c :2000
# warning above 10W
# critical above 2000W
}
define service{
use generic-service
host_name netio
service_description NetioOutput3Current
check_command check_snmp!.1.3.6.1.4.1.47952.1.1.1.28.3!10:!5:
# /usr/lib/nagios/plugins/check_snmp -H 192.168.101.31 -C netioVkuchynce7523 -o .1.3.6.1.4.1.47952.1.1.1.28.3 -w 10: -c 5:
# warning below 10mA
# critical below 5mA
}
Restart Nagios:
service nagios3 restart
There should be two more services in the web interface that monitor the ranges defined above:

FAQ
1) SNMP interface in the NETIO smart sockets does not work
SNMP must be enabled, see the device manual for details. For a more detailed description of SNMP in NETIO sockets, see AN11 SNMP management of 110/230V power outlets from the command line in Windows and Linux
2) Triggers in Zabbix do not work
The trigger threshold values mentioned here are only valid for our particular example. In your specific case, you need to design a suitable evaluation method and calculate the appropriate trigger thresholds.
We recommend to test the validity of your expressions in the “Expression constructor” – Test button. We also recommend to check in the graphs whether the trigger thresholds are appropriate for the measured data.
3) How can I power-cycle an outlet in reaction to events / triggers in Zabbix?
This is typically the case when the monitoring discovers that the device is unresponsive and it is desirable to power-cycle it.
At the Zabbix server, create an Action with the server-side command to remotely switch the appropriate outlet off for a short time and then switch it back on (Short Off or Restart). This can be done over URL API (see AN19 URL API (http GET) protocol to control NETIO 4x power sockets/outlets 110 / 230V) or over SNMP v3.