
Supported devices:
What is Prometheus
Prometheus is widely used open-source systems monitoring and alerting toolkit. Since it's inception in 2012, many companies and organisations have adopted Prometheus and the project has very active developer and use community. It records real-time metrics in a time series database built using a HTTP pull model, with flexible queries and real-time alerting.
The Prometheus ecosystem consists of many specific components:
- the core Prometheus server which scrapes and stores time series data
- client libraries for instrumenting application code
- a push gateway for supporting short-lived jobs
- special-purpose exporters for services like HAProxy, StatsD, Graphite, etc. (or NETIO, in this case)
- an alertmanager to handle alerts
- various support tools

More about Prometheus on this link
NETIO exporter
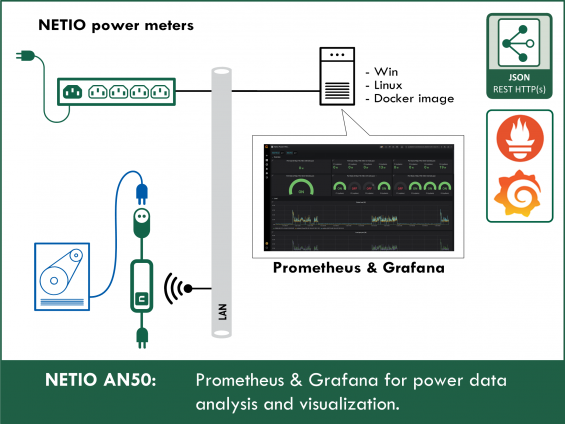
Some NETIO models are equipped with power measurement. This data is available via API. It is very useful to gain some insight into the historical trends of the data NETIO provides, to do some calculations and to be able to create alerts based on events reported by NETIO. Prometheus nicely extends the NETIO real-time monitoring capabilities with it's own time-series database and analytical tools.
Prometheus works in a pull based mode. It means it regularly requests time series data in a specific format. The format of the prometheus data looks roughly like this:
<metric name>{<label name>=<label value>, ...} <value>
api_http_requests_total{method="POST", handler="/messages"} 103
If we want Prometheus to scrape data from an application that does not support the Prometheus format natively, it needs to be connected via so called exporter. Prometheus exporter is basically a data bridge between the monitored application and Prometheus. It is an tool that on one side connects to the monitored application via the application's interface and on the other side provides the data translated to the Prometheus format.
Because NETIO does not support the prometheus format natively, the data needs to be translated via an exporter. There is an opensource NETIO Exporter that does exactly that. This exporter utilizes the JSON API to get the relevant data from the NETIO power sockets.
![]()
Grafana
Prometheus is awesome as a metrics data storage and alerting tool. Although it has a basic UI that could be used for quick searches and simple visualisations, it is not ideal for nice data presentation and persistent dashboards. This the area where Grafana excels.
Grafana is open source visualization and analytics software. It allows you to query, visualize, alert on, and explore your metrics no matter where they are stored.
In plain English, it provides you with tools to turn your time-series database (TSDB) data into beautiful graphs and visualizations.
How to put it all together
Prometheus installation
First we need to intstall Prometheus.
There are many options on how to install Prometheus.
The easiest way is to use the integrated package manager of your linux distribution.
For example apt install prometheus on debian based distributions.
More universal way to install it is via docker. Please follow the guide on this link.
For any way of installation, a configuration file for Prometheus (prometheus.yml) must be provided. Below is a minimal working example for scraping the NETIO Exporter.
# my global config
global:
  scrape_interval:     15s # Set the scrape interval to every 15 seconds. Default is every 1 minute.
  evaluation_interval: 15s # Evaluate rules every 15 seconds. The default is every 1 minute.

# A scrape configuration containing exactly one endpoint to scrape:
# Here it's Netio Exporter.
scrape_configs:
    # The job name is added as a label `job=<job_name>` to any timeseries scraped from this config.
  - job_name: 'netio'

    # metrics_path defaults to '/metrics'
    # scheme defaults to 'http'.

    static_configs:
    - targets:
      - 172.18.0.120:9595
      - 172.18.0.121:9595
      - 172.18.0.122:9595
Please be sure to update the targets section to point to the real addresses and ports of the running NETIO Exporters.
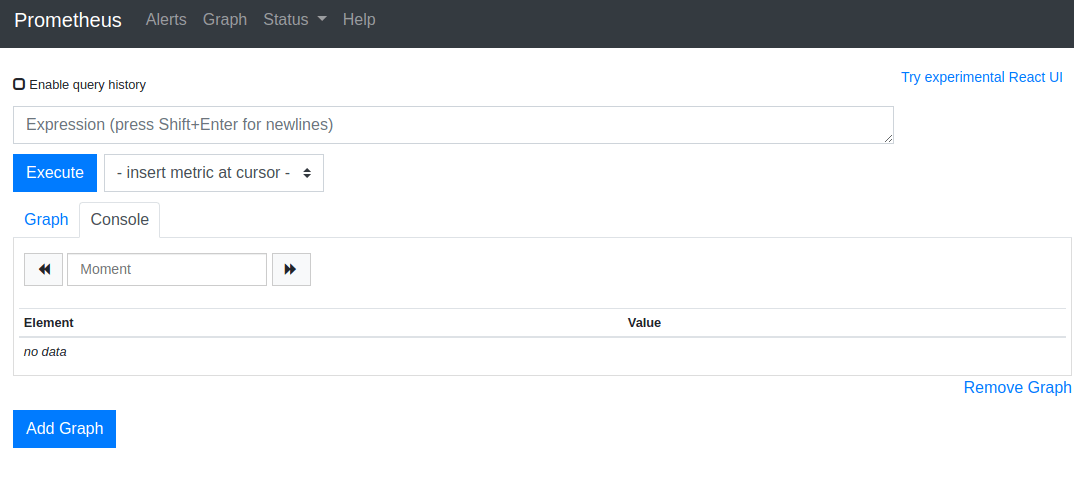
Once the prometheus is running, it will be available on your machine on port 9090. In most cases, it should be accessible on http://localhost:9090
It should look like this:
NETIO power socket
Before starting the NETIO Exporter, NETIO must be configured and JSON API enabled. The NETIO Exporter relies on the JSON API. The NETIO exporter needs only read access, authentication with username and password is optional.
NETIO Exporter
NETIO Exporter can be run either natively or in Docker. It has a few configuration options. The most important are:
- NETIO_URL parameter. This configuration is required. NETIO JSON API endpoint must provided. For example http://192.168.0.1/netio.json. Please note that this value will depend on you NETIO network setup.
- NETIO_USERNAME - optional username parameter
- NETIO_PASSWORD - optional password parameter
For more detailed configuration, please see https://github.com/tomsajan/netio-exporter#configuration
Natively
To run NETIO exporter natively, clone the repository:
git clone https://github.com/tomsajan/netio-exporter.git
and follow the guide
Docker
It is even easier to start it in Docker, because no additional setup (like installing python dependencies) is needed. There is already a prebuilt NETIO exporter docker image.
Running it is as simple as:
docker run -tid -p 9595:9595 -e NETIO_URL=http://192.168.0.242/netio.json -e NETIO_USERNAME=netio -e NETIO_PASSWORD=netio --name netio-exporter tomsajan/netio-exporter:latest
Please update the command to suit to your environment, i.e. update the NETIO URL and username/password combo (or remove it if no password needed). Again, please refer to the configuration guide on the github page.
Multiple NETIO power sockets
The NETIO exporter should be now running and listening on port 9595 (by default). If you want to monitor more NETIO power sockets, a NETIO exporter must be started separately for each of them. Please update the prometheus.yml configuration file accordingly to include the adresses and ports of all the running netio-exporter instances.
Data in Prometheus
If all works, Prometheus should start receiving data from NETIO. You can head over to the prometheus UI (most probably available on http://localhost:9090). Metrics from the netio exporter are prefixed with netio_ (see more here). Start typing netio and it should offer you some NETIO metrics. Selecting netio_agent_info will display current general information about the power sockets
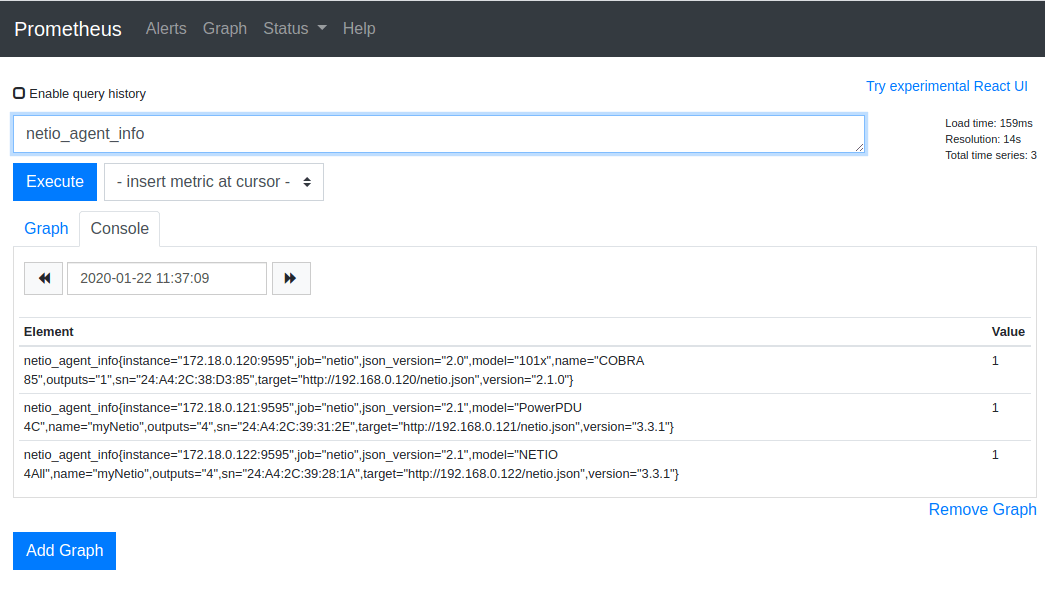
At this moment you are free to explore more metrics at you will.
Grafana
Although Prometheus can do some basic graphs, it is not intended as data visualisation tool. To get better view of what's going on in you NETIO power sockets, let's take a look on Grafana.
Grafana can be installed in many ways, including distribution specific packages and docker. Please see the installation guide. But again, installing via Docker should be pretty easy for just a test.
docker run -d -p 3000:3000 grafana/grafana
The Grafana UI will be available on the port 3000 on your machine. The most useful feature of Grafana in our context is it's dashboarding. It allows us compose a dashboard from multiple graphs to give us a quick overview of a certain field. But before we dive into the dashboards, we need to configure grafana to use the prometheus we installed previously as it's datasource. Note that grafana is fairly universal tool that can cooperate with many different kinds of datasources.
- head over to the grafana UI
- admin/admin should be the default username/password
- go to the /datasources configuration

- add prometheus datasource
- set correct address of the prometheus instance including port


Now it is ready to access Prometheus (and NETIO within it) data.
The author of the netio-exporter was so kind that he prepared also a related Grafana dashboard which visualises the data the netio-exporter produces.
Including it into grafana is very easy. Click on the plus sign on the top left corner and select import. In the next dialogue paste dashboard ID 12022 and click load. Then on the next step select the previously created prometheus datasource (bottom line) and click import. Now within a second you new dashboard tailored for NETIO will appear.


This is how the dashboard looks like with three NETIO power socket connected to prometheus.
