
Supported devices: PowerCable REST 101x, PowerPDU 4C, PowerPDU 8QS
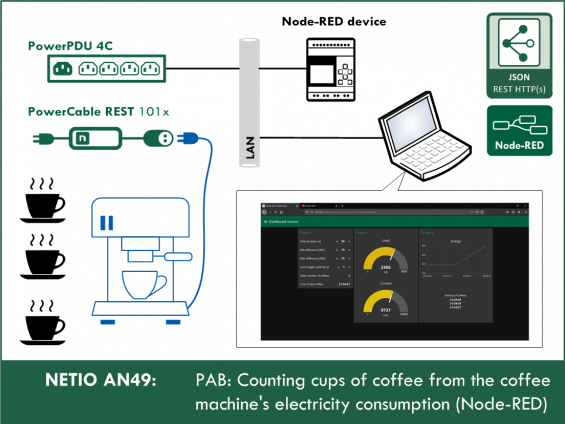
The AN49 analysis objective is to count the actions according to pre-set consumption (Wh) patterns and print the number of registered actions as well as the time of the last action in Node-RED. AN49 shows a practical use case for energy metering with NETIO smart sockets and Node-RED.

The example is devided into several parts according to the desired output:
- AN49a - vDisplays a message in a Node-RED internal node. This version has no interface.
- AN49b - Dashboard version (parameters can be modified, values are shown)
- AN49c - Display version, outputs to a 16x2-character LCD
- AN49d - XML API instead of JSON API
- AN49e - Continuously updated coffee counter, with the time of the last coffee
What is a PAB (Power Analyzer Block)
To analyze the behavior of a device from the power it draws, various approaches and algorithms are needed. In NETIO, we started to call these algorithms “PAB” (Power Analyzer Block) according to their suitable applications.
How to detect repeated actions from power consumption
The main idea behind NETIO AN49 is to count repeated actions (e.g. the process of making one cup of coffee) in real time by looking at the time history of electricity consumption (Wh). Energy consumption can be used to determine whether the specific action occurred or not. PAB AN49 is suitable for mechanical machines and actions such as:
- Counting the cups of coffee made by a coffee machine
- Counting the number of times a garage door is opened/closed
- Counting the number of elevator rides
- Counting the work cycles of a generic mechanical machine
What is an action
The following graph shows the load and the energy consumed when making one cup of coffee.

The Energy Counter [Wh] graph shows the increase in the energy consumption counter, and the Load [W] graph shows the power [W] (current [A]) increase whenever the heating compressor is running during the cycle of making a coffee.
The PAB AN49 algorithm does not use the immediate current but only the energy counter. This is to avoid measurement errors due to current spikes. In the Load [W] graph, the process of making one cup of coffee is clearly visible. In the Energy Counter [Wh] graph, it is not apparent at the first glance but the algorithm can spot it just as well.
One coffee (the action in question) consumes 9 Wh in about 25 seconds. Therefore, the action to detect lasts 25 seconds and the energy difference is 9 Wh; these values are used to configure the parameters.
Counting the actions – PAB (Power Analyzer Block) for AN49
The graph below shows the interval that is counted by the algorithm as one action, as long as the energy consumption increase (the difference between the first and the last value in the measured segment) lies within the specified bounds.
From the graph shown above it follows that the action (a cup of coffee) consumes 9 Wh in about 25 seconds. This lets us estimate the lower and upper bounds ((3) - Minimum consumption in the measured segment) and ((4) - Maximum consumption in the measured segment). Lower bound = 7Wh and upper bound = 11Wh.
The following graph shows the parameters as used in our example.
The AN49 Application Note uses five parameters.
- NETIO device data polling period
- Duration of the measured segment
- Minimum consumption in the measured segment
- Maximum cunsumption in the measured segment
- Guard zone

The following figure shows some sample actions (a) to (d) in the measured segment.

- This action is not counted because the increase is too steep. To count this action, the measured segment would have to be shorter ((2) - Duration of the measured segment) and the lower and upper bounds (3) - Minimum consumption in the measured segment and (4) - Maximum consumption of the segment, because the action consumes much more energy than the parameters specify.
- This action is counted because the difference between the last and the first value in the measured segment is within the bounds of (3) - Minimum consumption in the measured segment and (4) - Maximum consumption of the measured segment, therefore, the conditions for counting the action are met.
- This is a catch. No action can ever look like this. The values are read from the energy meter in your NETIO device, which counts in a cumulative way and can only increase. Each and every reading can only be equal to or higher than the previous value.
- This action is not counted because the difference between the last and the first value in the measured segment is below (3) - Minimum consumption in the measured segment, therefore, the conditions for counting the action are not met. To count such an action, the (3) - Minimum consumption in the measured segment and (4) - Maximum consumption of the measured segment.
Note: All values can be analyzed with the NETIO Power Analyzer utility; see NETIO AN42.

AN49 structure
- Launching NETIO AN49a for the first time
- Parameters
- Adjustment and customization options
- FAQ
1) Launching NETIO AN49a for the first time
When launching NETIO AN49a for the first time, it is necessary to configure the JSON API protocol in your NETIO smart socket device, import the NETIO Power Analyzer flow and configure the “http request” nodes.
Configuring the NETIO smart socket device
In the M2M API Protocols - JSON API section of the web interface, enable JSON API.
Set the Username and Password for READ-WRITE access.
READ-WRITE credentials allow both reading and writing. The same READ-WRITE credentials can be used in both types of HTTP Request nodes (POST and GET).
Click Save Changes. After saving the changes, the device restarts (this takes about 1 minute).

Node-RED
Node-RED is a programming tool for wiring together hardware devices, APIs and online services in new and interesting ways. Node-RED provides a browser-based flow editor and a wide choice of nodes and options. It is built on Node.JS, making it ideal to run on low-cost hardware such as the Raspberry Pi as well as in the cloud.
Note: For details about installing node-RED, about the Dashboard and about installing missing nodes, see Application Note AN29: Node-RED example of URL API communication with NETIO 4x
AN49a flow (skript)
The Node-RED configuration is specified in a json structure and can be pasted via the clipboard.
Importing the AN49a flow to Node-RED
In the menu, select Import -> Clipboard.
Then, copy the text to the indicated field and click Import.

Installing missing nodes.
The nodes are loaded into the selected flow. It is possible that an error message is displayed with a list of nodes that need to be imported but are not installed in Node-RED yet. In this case, the missing nodes need to be installed.
If there are any nodes missing, select Manage palette in the menu, click Install and find the missing nodes.
For a detailed description of how to install missing nodes and import the flow, see AN29: Node-RED example of URL API communication with NETIO 4x
NETIO AN49a flow
If everything works as expected, the flow should be imported and should look like this:

Now set the address of your NETIO smart socket device in the http request node.

In the http request node, insert the address of your NETIO smart device and the READ-WRITE access credentials (if set).


Node-RED
The Node-RED environment can run on a PC, a Raspberry Pi, in a cloud (MS Azure, IBM) and so on. Node-RED is very popular, so we have prepared more examples:
- AN29: Node-RED example of URL API communication with NETIO 4x
- AN30: Node-RED example of REST JSON communication with NETIO 4x
- AN31: Node-RED example of XML communication with NETIO 4x
- AN32: Node-RED example of Modbus/TCP communication with NETIO 4x / PowerCable
At this point, your AN49a flow should be imported and the http request node configured. The following section shows the remaining step – how to set the program parameters.
2) PAB parameters
Note: In AN49, the production of one cup of coffee is used as an example of the action to detect.


The PAB (Power Analyzer Block) in AN49 needs 5 parameters to function correctly:
- NETIO device data polling period – The default is 1 second. This parameter can be changed but we recommend keeping the default value.
- Duration of the measured segment (total_duration) [s] – Determines the duration of the measured segment (how many values should be contained in the segment).
- Minimum consumption in the measured segment (min_difference) [Wh] – Lower bound of the consumption in the measured segment. For an action to be counted, the difference between the first and the last measured value in the measured segment must be equal to or higher than this parameter. We recommend setting this value to about 10%–30% less than the Wh consumed by the action.
- Maximum consumption in the measured segment (max_difference) [Wh] – Upper bound of the consumption in the measured segment. For an action to be counted, the difference between the first and the last measured value in the measured segment must be equal to or lower than this parameter. We recommend setting this value to about 10%–30% more than the Wh consumed by the action.
- Guard zone (post_trigger_waiting) [s] – This parameter helps to separate individual actions if they occur in a rapid succession, or if the measured device is volatile and there is a risk of counting several actions as one. The parameter specifies how many times in a row must the condition (Minimum consumption in the measured segment) remain unsatisfied before the next action can be counted.
Here is an example to clarify the parameters. We want to measure how many cups of coffee are produced by the coffee machine in a day. We know that the making of a cup of coffee (the action) takes 25 seconds and consumes 7 Wh. We leave the NETIO device data polling period set to 1s. We know that the Duration of the measured segment is 25 seconds. Since one cup of coffee consumes 7 Wh, we set the Minimum consumption in the measured segment to 6 Wh and the Maximum consumption in the measured segment to 8 Wh. We set the Guard zone to 5 seconds because we know that the coffee capsule needs to be changed in the machine and this takes at least 5 seconds.
Determining the parameters
To determine the parameters, we recommend using the NETIO Power Analyzer described in AN42.
Note: For detailed instructions how to download, set up and use the NETIO Power Analyzer, see NETIO AN42.
- Step 1) Start the NETIO Power Analyzer
- Step 2) Fill in the pathname of a .csv file for logging the values (for details, see AN42)
- Step 3) Start the measurement
- Step 4) Perform the action that should be counted
- Step 5) Stop the measurement (for more clarity in the data, we recommend to wait a few seconds before and after the action)
Now you should have a .csv file that looks like this:

We are interested in values in columns C (voltage), D (energy) and E (current). From the increases in voltage, energy or current, it should be apparent when the measured action began and when it ended.

This lets us determine the segment duration [s]. The difference between the last energy value and the first one is the energy consumed [Wh]; this lets us set the lower and upper bounds.
In this example: From the highlighted part of the .csv we determine that the segment duration is 27 seconds. The difference between the first and the last energy value in the segment determines the consumption: 33136 – 33127 = 9 Wh. As already mentioned, we recommend to set the lower and upper consumption bounds 10%–30% below and above the determined consumption, so min = 7 Wh and max = 11 Wh. The specifics of the action to measure need to be considered when determining the minimum and maximum consumption and the guard zone between actions.
Setting the parameters

- NETIO device data polling period – We recommend to keep the default value
- Duration of the measured segment
- Minimum consumption in the measured segment
- Maximum consumption in the measured segment
- Guard zone
The parameters are set in the main logic function node only.

Set the parameters in the same way as below.

Note:
If you change the NETIO device data polling period, the change also affects the Duration of the measured segment. For example, if the NETIO device data polling period is set to 2s to reduce the polling frequency (e.g. the action takes as long as 2 minutes so it is easy to detect), the Duration of the measured segment needs to be halved (3s - reduced to one third, 4s - to one quarter). This is because the AN42 NETIO Power Analyzer reads the data and logs it to the csv once per second but in this AN49 the polling period was set to 2s.
If you followed the instructions, your program should be fully set up.
3) Adjustment and customization options
This section describes various ways to modify the NETIO AN49 flow to better suit your needs. These modified flows demonstrate a few ideas for such modifications.
AN49b - Dashboard version
In this version, parameters can be modified in a dashboard. Moreover, values are read from the NETIO smart socket device and displayed in real time.
Note: In AN49b, parameters are set in the dashboard

AN49c - Display version
This version of NETIO AN49 shows how to implement a flow with a display (such as a display connected to a Raspberry Pi). In our version, we used the display Serial Enabled 16x2 LCD. Your display is probably different so we recommend to read its technical specifications.

AN49d - XML API instead of JSON API
This example uses XML instead of JSON. It is useful if you need to have XML API enabled in your NETIO smart socket instead of JSON API.
Note: For details on configuring XML API on your smart socket device or in Node-RED, see Application Note AN31: Node-RED example of XML communication with NETIO 4x.

AN49e - Continuously updated coffee counter, with the time of the last coffee
In AN49a, the counter is only displayed after a successfully detected action.

If you want to display the counter continuously, import the following flow.
The flow is identical with AN49a, except that it displays the counter every second (to be precise, according to the (1) Data polling period parameter)

Reading data from an output other than 1
Some NETIO products have more outputs, and it may be necessary to analyze e.g. output no. 3. The number of the output needs to be changed in the main logic function node. In this context, output numbers start from zero! Therefore, the first output has the number 0 and the fourth output has the number 3.
Example: var energy = msg.payload.Outputs[0].Energy;

And this is how we do the power analysis in the office:

FAQ
1) Is it possible to use an IP address different from the pre-filled one?
Yes, use the IP address of your own device. The IP address is specified in the HTTP Request node.
2) Where can I find instructions to install node-RED?
For detailed instructions on how to install node-RED, see AN29: Node-RED example of URL API communication with NETIO 4x
3) Is it possible to test NETIO AN49 with the NETIO online demo?
Yes, NETIO AN49 can be tested with NETIO online demo devices.
To access the NETIO online demos, log in as demo / demo at the following sites:
http://netio-4all.netio-products.com/
https://netio-4c.netio-products.com/
http://pc-rest.netio-products.com/
4) When using the NETIO Power Analyzer, the csv log file was not created. What’s wrong?
The file path is probably incorrect. The path and filename should look similar to this: C:/Users/John/Desktop/log.csv
5) Where can I find instructions on how to install missing nodes?
For a detailed description on how to install missing nodes in an imported flow, see: AN29: Node-RED example of URL API communication with NETIO 4x
6) In the debug section of Node-RED, the following message appears: Error: connect ETIMEDOUT.
Most likely, the IP address in http request node is incorrect.
7) In the debug section of Node-RED, the following message appears: {"Result":{"Error":{"Code":401,"Message":"Unauthorized"}}}
The login credentials in the http request node are incorrect.
8) I have changed the flow in Node-RED but the changes are not reflected in the Dashboard.
To save and display all changes in a flow, it is necessary to click Deploy in the top right corner in Node-RED.
9) My action is counted multiple times.
The Guard zone (post_trigger_waiting) is probably set too low.
10) My action is not counted.
The parameters are incorrect. Most likely, the energy difference bounds (Minimum consumption in the measured segment (min_difference) and Maximum consumption in the measured segment (max_difference)) are incorrect.
Supported FW versions for NETIO 4x:
3.1.0 and higher (Firmware archive)
Supported FW versions for PowerCable xxx:
2.0.2 and higher (Firmware archive)