
Supported devices: PowerCable REST, NETIO 4All, PowerPDU 4C, PowerDIN 4Pz, PowerBOX 4Kx, PowerPDU 8QS
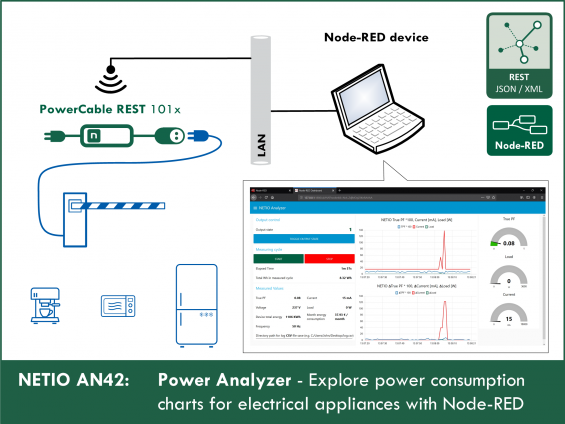
NETIO Power Analyzer is a simple tool for analyzing the energy consumption waveform of any 230V appliance. With AN42, anyone can explore the behavior of their refrigerator, coffee machine, vacuum cleaner, and so on.
Capabilities of AN42 NETIO Power Analyzer
- Works with the PowerCable REST 101x WiFi power socket
- The power output can be switched on/off from the user interface
- Detailed consumption chart (A, W, TruePF) for the last 60 seconds
- Detailed chart of delta values (derivatives of A, W, TruePF) for the last 60 seconds
- Measurements stored in a CSV file for later use
- 8 detailed charts for the entire duration of the measurement
To draw the charts and create a simple UI, in this AN42 we have chosen Node-RED which can run on almost any platform. Besides the main screen, additional 6 detailed charts are available in the top left menu.
Examples of AN42 NETIO Power Analyzer results

Structure of this AN42
- NETIO Power Analyzer dashboard example
- Starting NETIO Power Analyzer for the first time
- How to control NETIO Power Analyzer
- Measurement examples with real appliances
- Modifying NETIO Power Analyzer to work with NETIO devices other than NETIO PowerCable REST
1) NETIO Power Analyzer dashboard example
Note: For details about installing node-RED, about the Dashboard and about installing missing nodes, see Application Note AN29: Node-RED example of URL API communication with NETIO 4x
This is the NETIO Power Analyzer dashboard:

The Dashboard consists of 6 parts:
- True PF (*100), Current and Load chart showing the last 60 seconds
- Chart with (delta) Δ True PF (*100), Δ Current and Δ Load for the last 60 seconds
- Indicators of the immediate TruePF, Current and Load values
- Controls to start and stop the measurement, with indication of time elapsed and total consumption
- Immediate values of all measured parameters
- NETIO output socket control with the state indicator

More charts
More charts are available in the Dashboard menu.

The AN42 dashboard includes 8 additional charts. Each chart shows the measured values for the last 60 minutes, so that you can look back at what has been happening.

A large chart with TPF (*100), Current and Load values for the last 60 minutes

2) Starting NETIO Power Analyzer (Node-RED flow) for the first time
When launching the NETIO Power Analyzer for the first time, it is necessary to configure the JSON API protocol in your NETIO smart socket device, import the NETIO Power Analyzer flow and configure the “http request” nodes.
Configuring NETIO 4x and PowerCable REST smart socket devices
In the M2M API Protocols - JSON API section of the web interface, enable JSON API.
Set the Username and Password for READ-WRITE access.
READ-WRITE credentials allow both reading and writing. The same READ-WRITE credentials can be used in both types of HTTP Request nodes (POST and GET).
Click Save Changes. After saving the changes, the device restarts (about 1 minute).

NETIO 4All Online demo

The online demo is a physical NETIO device connected to the Internet at a public IP address. The manufacturer makes available a demo device of each model. The online demos have different configurations, so it is possible to test the behavior without having the devices physically in hand.
In the online demos, configuration changes cannot be saved.
To access the online demo of a product, click “TRY ON-LINE DEMO” at the respective product page.
Node-RED
Node-RED is a programming tool for wiring together hardware devices, APIs and online services in new and interesting ways. Node-RED provides a browser-based flow editor and a wide choice of nodes and options. It is built on Node.JS, making it ideal to run on low-cost hardware such as the Raspberry Pi as well as in the cloud.
AN42 flow (skript)
The Node-RED configuration is specified in a json structure and can be pasted via the clipboard.
Importing the AN42 flow to Node-RED
In menu, select Import -> Clipboard.
Then, copy the text to the indicated field and click Import.

Installing missing nodes
The nodes are loaded into the selected flow. It is possible that an error message is displayed with a list of nodes that need to be imported but are not installed in Node-RED yet. In this case, the missing nodes need to be installed.
If there are any nodes missing, select Manage palette in the menu, click Install and find the missing nodes.
For a detailed description of how to install missing nodes and import the flow, see AN29: Node-RED example of URL API communication with NETIO 4x
NETIO Power Analyzer flow
If everything works as expected, the flow should be imported, any missing nodes installed and the flow should look like this:

Now it is necessary to configure all 3 http request nodes.

In each http request node, insert the address of your NETIO smart device and the READ-WRITE access credentials (if set).


Node-RED
The Node-RED environment can run on a PC, a Raspberry Pi, in a cloud (MS Azure, IBM) and so on. Node-RED is very popular, so we have prepared more examples:
- AN29: Node-RED example of URL API communication with NETIO 4x
- AN30: Node-RED example of REST JSON communication with NETIO 4x
- AN31: Node-RED example of XML communication with NETIO 4x
- AN32: Node-RED example of Modbus/TCP communication with NETIO 4x / PowerCable
3) Using the AN42 NETIO Power Analyzer
NETIO Power Analyzer is a unique tool that lets you observe subtle changes in TPF, load, voltage or current. You can control the output and watch changes in the monitored parameters in real time, and also obtain a log file with all the measurements for later analysis.
Log file with the measured values

To create a log file in NETIO Power Analyzer with the measured values and record new measurements, enter the path for the log file and the log file name, ideally before starting the measurement.

If you forget to enter the path, it can be entered while measuring; however, values will be only logged from that moment on.
If you do not need a log file, NETIO Power Analyzer works fine without it. The log file is an optional feature.
Example of csv log file:
Time,MAC,Load,Energy,Current,Output state,TPF,Voltage,Frequency,TPF Difference,Current Difference,Load Difference
2019-9-10 19:13:10,24:A4:2C:39:11:5A,153,10166970,5377,1,0,358544.9,50.1,0.00,5377.00,153.00
2019-9-10 19:13:11,24:A4:2C:39:11:5A,148,10166970,5356,1,0.31,200.6,50.1,0.31,21.00,5.00
2019-9-10 19:13:12,24:A4:2C:39:11:5A,148,10166970,5357,1,0.31,200.6,50.1,0.31,5357.00,148.00
2019-9-10 19:13:13,24:A4:2C:39:11:5A,152,10166970,5373,1,0,358544.9,50.1,0.31,16.00,4.00
2019-9-10 19:13:14,24:A4:2C:39:11:5A,140,10166971,5320,1,0.3,200.1,50.1,0.30,5320.00,140.00
2019-9-10 19:13:15,24:A4:2C:39:11:5A,150,10166971,5364,1,0.31,200.7,50.1,0.01,44.00,10.00
2019-9-10 19:13:16,24:A4:2C:39:11:5A,154,10166971,5381,1,0,358545,50.1,0.31,17.00,4.00
2019-9-10 19:13:17,24:A4:2C:39:11:5A,171,10166974,5460,1,0,358546.1,50.1,0.00,5460.00,171.00
2019-9-10 19:13:18,24:A4:2C:39:11:5A,169,10166974,5449,1,0,358545.9,50.1,0.00,11.00,2.00
2019-9-10 19:13:19,24:A4:2C:39:11:5A,169,10166974,5453,1,0,358545.9,50.1,0.00,4.00,0.00
2019-9-10 19:13:20,24:A4:2C:39:11:5A,174,10166974,5472,1,0,358546.2,50.1,0.00,5472.00,174.00
2019-9-10 19:13:21,24:A4:2C:39:11:5A,171,10166985,5459,1,0,358546,50.1,0.00,5459.00,171.00
2019-9-10 19:13:22,24:A4:2C:39:11:5A,173,10166985,5466,1,0,358546.2,50.1,0.00,7.00,2.00
2019-9-10 19:13:23,24:A4:2C:39:11:5A,173,10166985,5466,1,0,358546.1,50.1,0.00,0.00,0.00
NETIO Power Analyzer controls
The NETIO Power Analyzer is controlled with three elements:
- START button
- STOP button
- TOGGLE OUTPUT STATE button

START
The START button starts the cycle of downloading measured data from your NETIO smart device using the http request node (HTTP GET) once per second as well as displaying the data in the Dashboard. If the log file path and filename are filled in, the measured data are also written to the log file once per second.
When the START button is pressed, existing measurements and charts are cleared and a new measurement session is started.
STOP
The STOP button stops the measurement session and the downloading of data from your NETIO smart device.
NOTE: The STOP button does not clear data or charts; the recorded measurements are still shown.
TOGGLE OUTPUT STATE
The button uses the http request node (HTTP POST) to send a command to your NETIO smart sockets device to toggle its output.
4) Measurement examples with real appliances

Cofee machine
How much energy [Wh] is needed to make a cup of coffee?
NETIO Power Analyzer makes it easy to find out.
The coffee machine in our NETIO office uses about 8 Wh of electricity (corresponds to about 0.0016 €) per cup of coffee.

Consumption chart for the making of a cup of coffee
At first, the coffee machine preheats. Then it starts making the cup of coffee. The chart shows the changes in current and voltage.


Fridge
Fridge consumption in the course of one hour.
As shown in the picture, the fridge consumed about 24.4 Wh during the hour.
24.4 Wh per hour equals about 220 kWh per year, and assuming 0.2 €/kWh, costs about 43 € per year.
Thanks to NETIO Power Analyzer, you may discover that your old fridge consumes much more electricity than it should. Maybe it is faulty, maybe it is just energy-inefficient. And this applies to all electrical appliances.

This chart shows that the fridge door was open three times. This led to a rise in temperature, and the compressor started cooling.


Microwave oven
What does the power consumption look like when heating up a dish? How much does it cost to heat up the dish? Let us see
During the minute and half, the microwave consumed 24 Wh.
At a rate of 0.2 € / 1 kWh, this comes to about 0.005 € (half a eurocent).

Chart detail:


Laptop computer
How much energy does your laptop really consume? And what happens when charging the laptop?
During an hour of use, the laptop consumes approximately 31 Wh. That is 277 KWh per year, corresponding to about 55 €.

As seen in the chart, the TruePF of the power adapter fluctuates quite a bit.

Laptop with a discharged battery
When the battery is low, the charts show that the current and load are almost twice as high during the first 10 minutes (while the battery charge remains under the critical level of 20%). It is interesting to see that True PF is more stable and less fluctuating during that time.

5) Modifying NETIO Power Analyzer to work with NETIO devices other than NETIO PowerCable REST
NETIO Power Analyzer is designed to be very simple to use, even if you use a device other than the NETIO PowerCable REST. NETIO Power Analyzer will work with other NETIO smart socket devices, as long as they are capable of measuring electrical parameters. All that is necessary to change manually is the number of the output to control and monitor, if it is different from 1.
Changing the measured output
The output to measure needs to be changed at two places:

Function blok – Load values

The number of the output needs to be changed everywhere in the Load values function node. Outputs are numbered starting from zero here! Therefore, the first output has the number 0 and the fourth output has the number 3.
For example: msg.Current = msg.payload.Outputs[1].Current
Button node– Toggle output state
Here, the ID of the output needs to be changed.
For example, to control the output no. 2, the ID value would be 2.
{ "Outputs": [{ "ID": 2, "Action": 4 }] }

FAQ
1) Is it possible to use an IP address different from the pre-filled one?
Yes, use the IP address of your own device. The IP address can be set in the HTTP Request nodes. It has to be changed in all three of them.
2) Is it possible to use a device other than NETIO PowerCable REST?
Yes, NETIO AN42 Power Analyzer is designed to work with any NETIO device that provides electrical measurements and supports the JSON API protocol. Without further configuration changes, the example will always work with the output no. 1.
To measure an output other than 1, see above: 5) Modifying NETIO Power Analyzer to work with NETIO devices other than NETIO PowerCable REST
3) Where can I find instructions to install node-RED?
For detailed instructions on how to install node-RED, see AN29: Node-RED example of URL API communication with NETIO 4x
4) Is it possible to test the NETIO Power Analyzer with the NETIO online demo?
Yes, NETIO Power Analyzer can be tested with NETIO online demo devices.
To access the NETIO online demos, log in as demo / demo at the following sites:
http://netio-4all.netio-products.com/
https://netio-4c.netio-products.com/
http://pc-rest.netio-products.com/
5) The csv log file was not created, what is wrong?
The file path is probably incorrect. The path and filename should look similar to this: C:/Users/John/Desktop/log.csv
6) Where can I find instructions on how to install missing nodes?
For a detailed description on how to install missing nodes in an imported flow, see: AN29: Node-RED example of URL API communication with NETIO 4x
7) Is it possible to plot a different time period in the charts than the default?
Yes, the displayed time period can be configured in each chart node.

8) In the debug section of Node-RED, the following message appears: Error: connect ETIMEDOUT.
Most likely, the IP address in http request node(s) is incorrect.
9) In the debug section of Node-RED, the following message appears: {"Result":{"Error":{"Code":401,"Message":"Unauthorized"}}}
The login credentials are incorrect.
10) 1) I have changed the flow in Node-RED but the changes are not reflected in the Dashboard.
To save and display all changes in a flow, it is necessary to click Deploy in the top right corner in Node-RED.
Supported FW versions for NETIO 4x:
3.1.0 and higher (Archiv firmware)
Supported FW versions for PowerCable xxx:
2.0.2 and higher (Archiv firmware)
This Application Note is compatible with:

|
NETIO 4AllNETIO 4All is a PDU module featuring four 230V/8A power sockets with consumption metering for each socket as well as LAN and WiFi connectivity. Each of the four sockets can be individually switched on/off over the Web or using various M2M API protocols. Electricity consumption (A, W, kWh) can be measured at each power socket. NETIO 4All smart sockets are designed for remote measurement and control of electrical sockets. Use the product whenever you need 230V sockets controlled by a mobile app, by a computer program (via M2M API) or by a custom script (Lua) that runs directly in the NETIO 4All smart socket device. |

|
NETIO PowerPDU 4CNETIO PowerPDU 4C is a small 110/230V PDU (Power Distribution Unit). Each of the four IEC-320 C13 outlets can be independently controlled (On / Off / Reset / Toggle). Electrical parameters (A, W, kWh, TPF, V, Hz) are measured with high accuracy at each outlet. The device features two LAN ports (and a built-in Ethernet switch) for connecting to a LAN. Each power output supports ZCS (Zero Current Switching) to protect the connected equipment. |
 |
PowerCable REST 101xNETIO PowerCable REST 101x is a smart WiFi power socket for integration with third-party systems using an open API. PowerCable REST features electrical measurements and control of the output using one of three http-based REST protocols - XML, JSON or URL API. |